

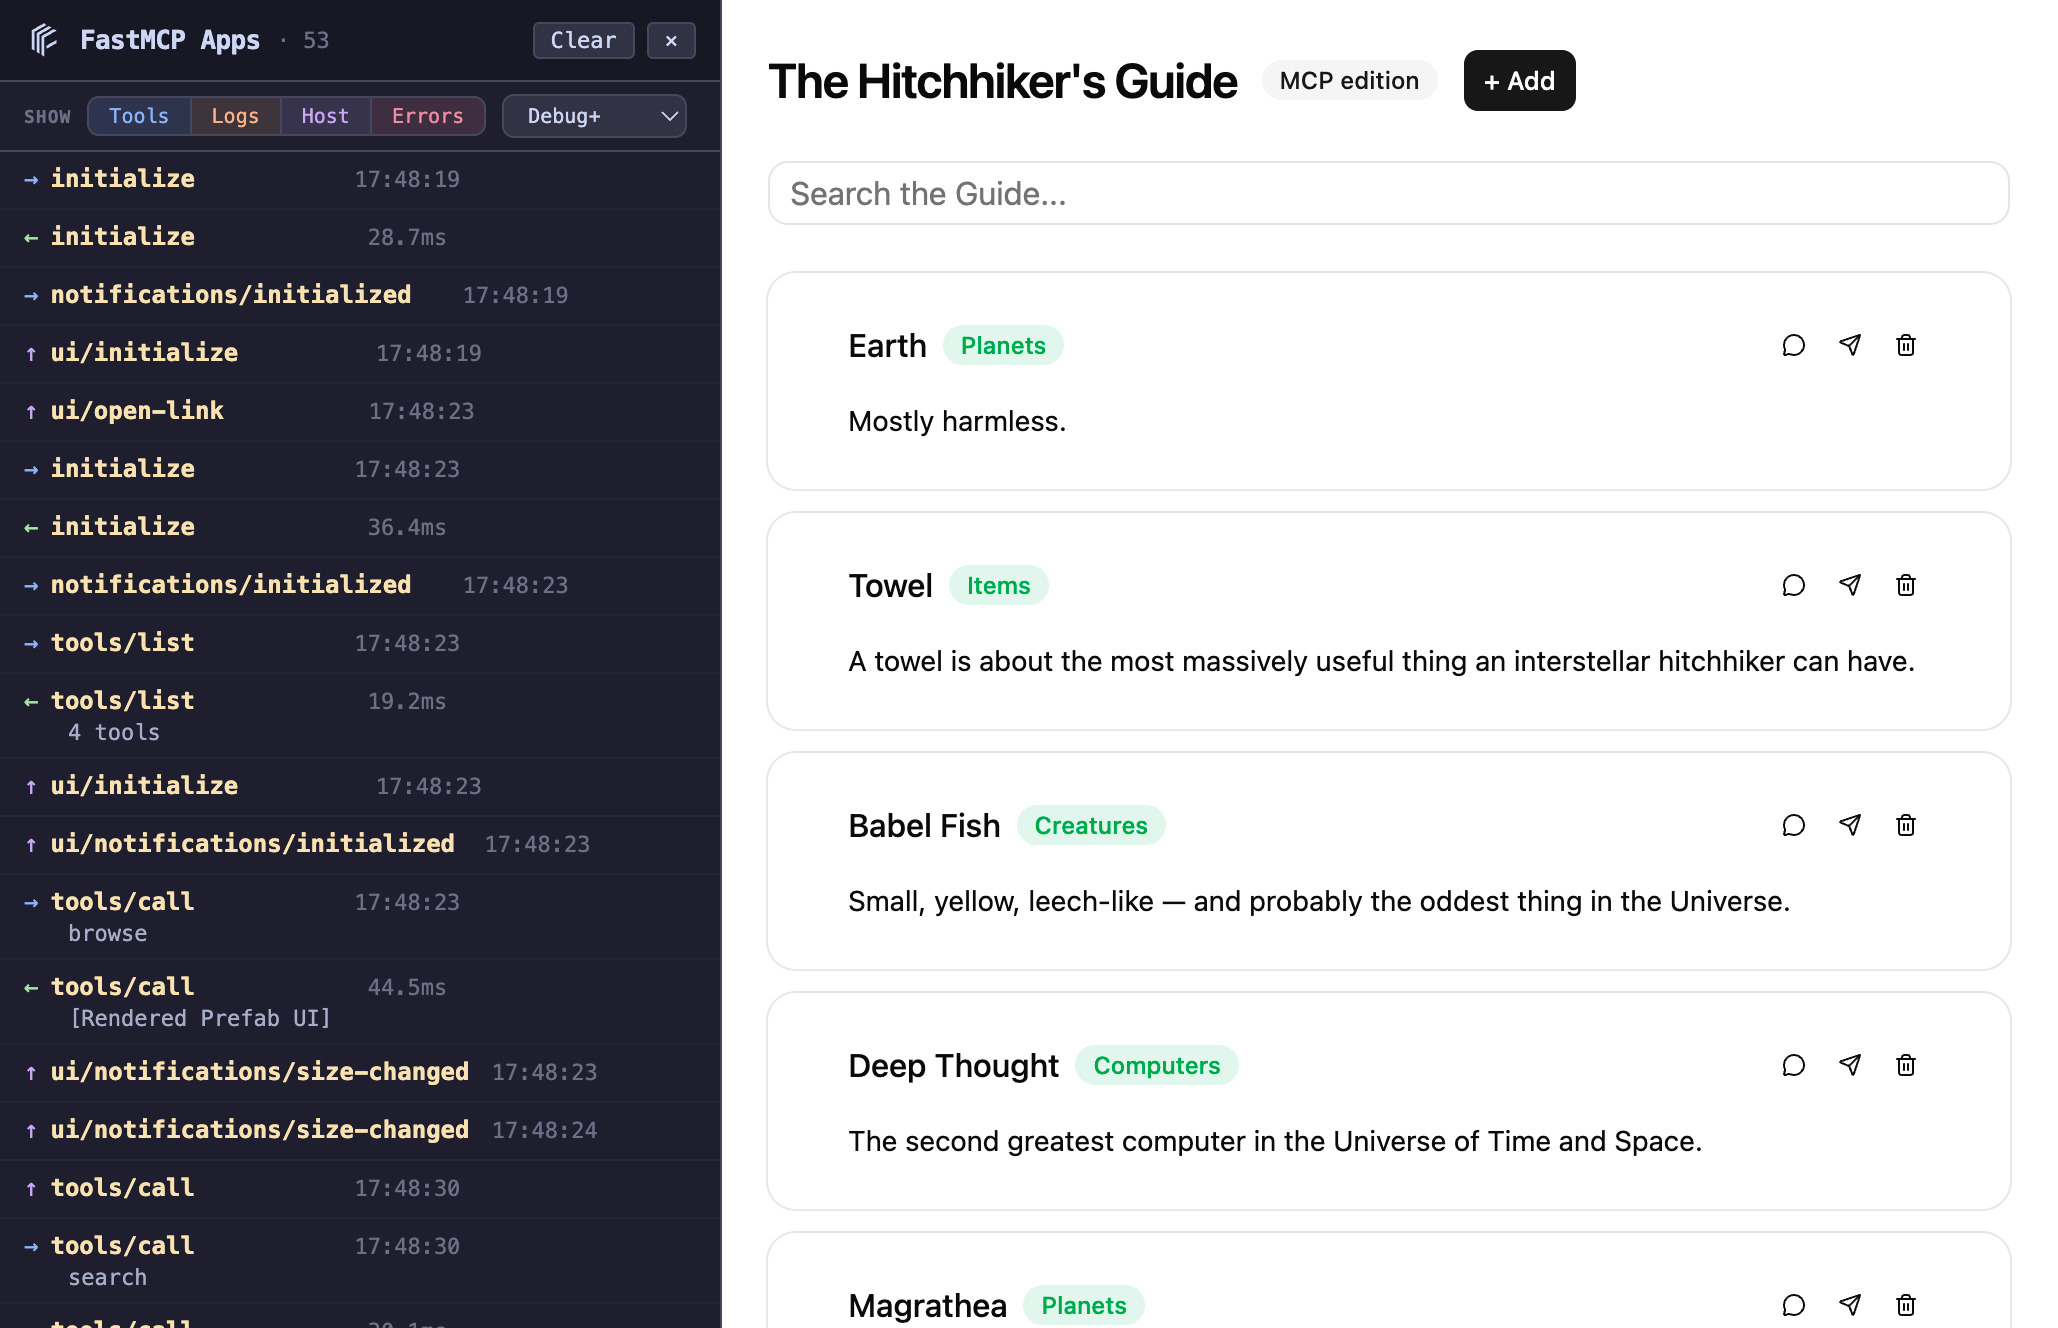
fastmcp dev apps gives you a browser preview for your app tools without needing an MCP host client. It starts your server and a local dev UI side by side: you pick a tool, fill in its arguments, and the rendered result opens in a new tab.
Works with both Interactive Tools and custom HTML apps.
Quick start
How it works
The dev server does three things: The picker page connects to your MCP server, finds all tools with UI metadata, and renders a form for each one. The forms are auto-generated from the tool’s input schema — text fields, dropdowns, checkboxes, all wired up. When you submit a form, the dev server calls your tool via the MCP protocol and opens the result in a new tab. Each result page comes from a picker launch and stays available, including on reload, until the dev server stops. The result page loads the tool’s UI resource (the Prefab renderer or your custom HTML) inside an AppBridge — the same protocol that real MCP hosts use. The resource runs in a sandboxed iframe, so it can’t uselocalStorage, open popups, or show alert and confirm dialogs.
A reverse proxy on /mcp forwards requests from the browser to your MCP server, avoiding CORS issues that would otherwise block the iframe-based renderer from talking to a different port.
MCP inspector
The dev UI includes an inspector panel on the left side that captures MCP traffic in real time. It shows JSON-RPC messages flowing between the browser and your server — requests, responses, and AppBridgepostMessage traffic.
Each entry shows direction, method, timing, and a smart summary. Click any entry to expand the full JSON-RPC body. The panel auto-scrolls to new messages unless you’ve scrolled up to inspect older ones.
The inspector is useful for debugging: you can see exactly what arguments your tool received, what it returned, and how the AppBridge communicated with the renderer.
Options
With
--host 0.0.0.0, open the dev UI through localhost or an IP address. To reach it by hostname, pass that hostname to --host.
Multiple tools
If your server has multiple app tools, the picker shows a dropdown. Each tool gets its own form and launch button. The tool’stitle is displayed when available, falling back to the tool name.