Repository navigation
Tweaks to frequency spectrum and sound ellipse in visualizer - #464
Conversation


Hm, I guess I had my font size to small to have noticed that. It's probably because that column is not guaranteed to be directly computed by the DFT, and (to prevent that drawing bug I found that occurs when I have cubic interpolation on) I set those columns to zero height. Not sure what the proper fix for that is. |

Can you explain? |
|
This is what I think is happening: the DFT can only be computed for a set number of frequencies. When it's plotted on the terminal, you'll eventually run into a case where you have less than one DFT data point being used to draw one column of characters, and in this case you have to do some interpolation to make the plot look continuous. This happens all the time when plotting on a log-scaled horizontal axis, but for some reason happens only for the leftmost column on the linear-scaled one. EDIT: I think if you used a super-small terminal font to increase the number of columns relative to the number of DFT points, you'd probably see more of this on the linear scale, but I haven't tested that. |
|
I know it's been ages, but if you're still interested in getting this merged, can you please:
|
|
Hey, sorry-- yeah this really fell off my radar for a while. Will do when I can! |


|
Hi, seems like this should be ready to go. Let me know if I need to do anything else (sorry if anything is wrong, this is my first time contributing to anyone else's project). |

|
Thanks! |

2 participants


Brings back the linear(-ish) axis scaling from pre-0.9.x (see #453) while keeping DFT adjustments made in #397 and adding config options
visualizer_spectrum_log_scale_xandvisualizer_spectrum_log_scale_yfor log scaling on either/both axes.Also switches the character used for the sound ellipse to
Config.visualizer_chars[0]fromConfig.visualizer_chars[1](by default this is the round character rather than the bar) because I thought it looked silly otherwise.Here's a sample of what the linear scaling looks like in my terminal:
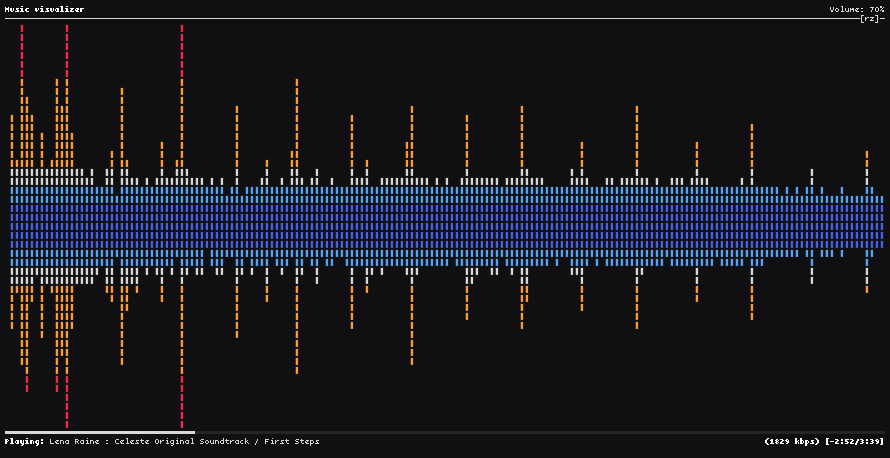
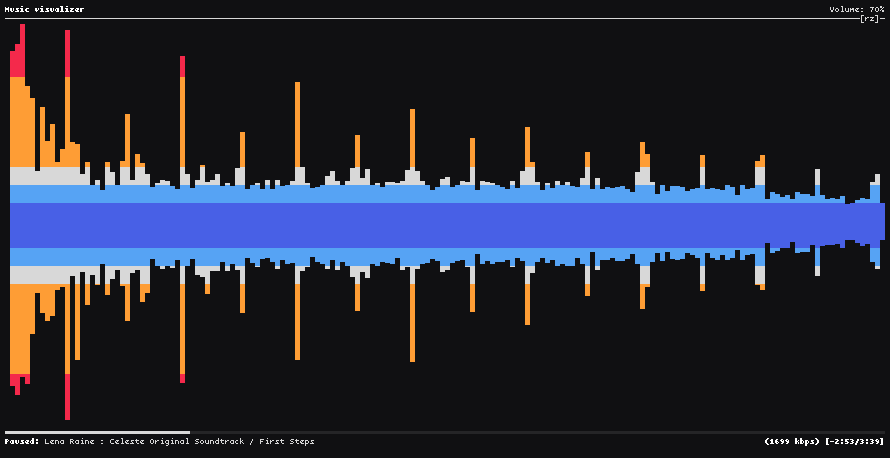
and with
visualizer_smooth_look = yes:A couple additional notes:
This usually isn't a problem with log scaling because the DFT always goes to zero at those low frequencies (assuming small enough
visualizer_spectrum_hz_min), but here it's quite bothersome, so when doing x-axis linear scaling, I set the height for bins not directly computed by the DFT to zero rather than interpolate, since I think it's not needed in this case anyway.visualizer_spectrum_gainis still in dB, for consistency with thevisualizer_spectrum_log_scale_y = yescase. The constants setting the vertical scale are set to my personal preference for defaultgain = 10and are slightly adjusted compared to pre-0.9.x (slightly less high-frequency boost).