Bug report
When using matplotlib in a Jupyter Notebook with the magic %matplotlib notebook, legends placed outside of the axis are cut off.
Code for reproduction
import matplotlib.pyplot as plt
# probably unnecessary/overkill, but reset all parameters to default
plt.rcParams.update(plt.rcParamsDefault)
%matplotlib notebook
fig, ax = plt.subplots(ncols=1, nrows=1)
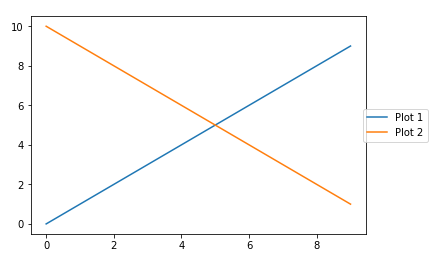
ax.plot(range(10), label="Plot 1")
ax.plot(range(10, 0, -1), label="Plot 2")
ax.legend(loc='center right', bbox_to_anchor=(1.20, 0.5))
Actual outcome

Expected outcome
The legend would be fully displayed as in the following example. This plot obtained by switching to %matplotlib inline
Matplotlib version
- Operating System: Windows 7, x64
- Matplotlib Version: 2.0.2
- Python Version: 3.6.2
- Jupyter Server: 5.0.0
- Other Libraries:
Matplotlib and python were installed using Anaconda
Additional Information
This seems similar to #2530
Bug report
When using matplotlib in a Jupyter Notebook with the magic
%matplotlib notebook, legends placed outside of the axis are cut off.Code for reproduction
Actual outcome
Expected outcome
The legend would be fully displayed as in the following example. This plot obtained by switching to

%matplotlib inlineMatplotlib version
Matplotlib and python were installed using Anaconda
Additional Information
This seems similar to #2530