Bug summary
We can plot multiple lines in one color with plt.plot, but not with plt.hist.
I'm not sure if this considered as a bug, but I can't understand why hist force this requirement.
Code for reproduction
import matplotlib.pyplot as plt

data = [[0, 1, 2], [3, 4, 5]]

plt.plot(data, color='k')
plt.show()

plt.hist(data, color='k')
Actual outcome
plt.plot works as expected, but plt.hist get the following error
ValueError: The 'color' keyword argument must have one color per dataset, but 2 datasets and 1 colors were provided.
Expected outcome
Just plot the histograms in same color
What I want to achieve is
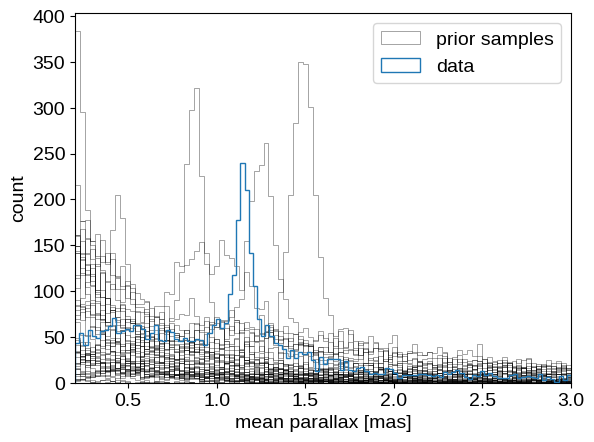

Additional information
No response
Operating system
No response
Matplotlib Version
3.10.8
Matplotlib Backend
No response
Python version
No response
Jupyter version
No response
Installation
None
Bug summary
We can plot multiple lines in one color with
plt.plot, but not withplt.hist.I'm not sure if this considered as a bug, but I can't understand why hist force this requirement.
Code for reproduction
Actual outcome
plt.plotworks as expected, butplt.histget the following errorExpected outcome
Just plot the histograms in same color


What I want to achieve is
Additional information
No response
Operating system
No response
Matplotlib Version
3.10.8
Matplotlib Backend
No response
Python version
No response
Jupyter version
No response
Installation
None