Bug summary
A contour plot is plotted with the minimum and maximum values of the parameter as color bar limits. Then when I try to make changes (such as limits and colormap) to the color bar from the toolbar of the generated plot it is not updating accordingly.

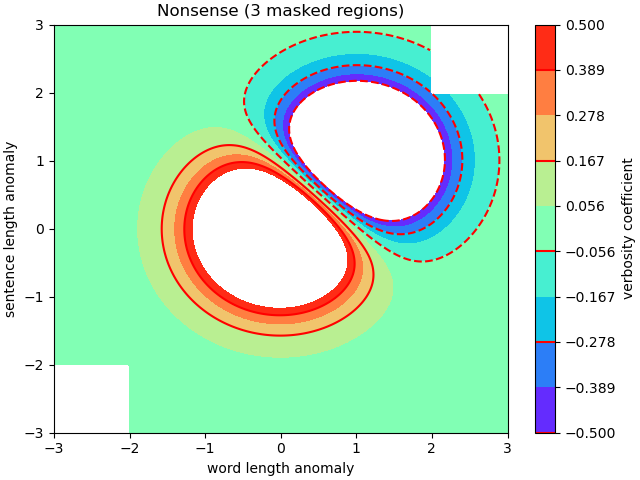
- A sample plot.

- Customizing the color bar.

- Options for changing the color bar.

- The changes are reflected in the color bar, but not in the plot.
Kindly suggest how I can update the plot according to the changes made in the color bar options.
Code for reproduction
# A sample code.
import numpy as np
import matplotlib.pyplot as plt

origin = 'lower'

delta = 0.025

x = y = np.arange(-3.0, 3.01, delta)
X, Y = np.meshgrid(x, y)
Z1 = np.exp(-X**2 - Y**2)
Z2 = np.exp(-(X - 1)**2 - (Y - 1)**2)
Z = (Z1 - Z2) * 2

nr, nc = Z.shape

# put NaNs in one corner:
Z[-nr // 6:, -nc // 6:] = np.nan
# contourf will convert these to masked


Z = np.ma.array(Z)
# mask another corner:
Z[:nr // 6, :nc // 6] = np.ma.masked

# mask a circle in the middle:
interior = np.sqrt(X**2 + Y**2) < 0.5
Z[interior] = np.ma.masked

fig1, ax2 = plt.subplots(constrained_layout=True)
CS = ax2.contourf(X, Y, Z, 10, cmap=plt.cm.bone, origin=origin)

# Note that in the following, we explicitly pass in a subset of the contour
# levels used for the filled contours.  Alternatively, we could pass in
# additional levels to provide extra resolution, or leave out the *levels*
# keyword argument to use all of the original levels.

CS2 = ax2.contour(CS, levels=CS.levels[::2], colors='r', origin=origin)

ax2.set_title('Nonsense (3 masked regions)')
ax2.set_xlabel('word length anomaly')
ax2.set_ylabel('sentence length anomaly')

# Make a colorbar for the ContourSet returned by the contourf call.
cbar = fig1.colorbar(CS)
cbar.ax.set_ylabel('verbosity coefficient')
# Add the contour line levels to the colorbar
cbar.add_lines(CS2)
plt.show()
Actual outcome

Expected outcome
The following changes have been made to the code in order to get the expected plot.
lev = np.linspace(-0.5, 0.5, 10)
CS = ax2.contourf(X, Y, Z, 10, cmap=plt.cm.rainbow, origin=origin, levels=lev)
Additional information
No response
Operating system
Windows
Matplotlib Version
3.4.3
Matplotlib Backend
Qt5Agg
Python version
Python 3.8.12
Jupyter version
No response
Installation
pip
Bug summary
A contour plot is plotted with the minimum and maximum values of the parameter as color bar limits. Then when I try to make changes (such as limits and colormap) to the color bar from the toolbar of the generated plot it is not updating accordingly.

Kindly suggest how I can update the plot according to the changes made in the color bar options.
Code for reproduction
Actual outcome
Expected outcome
The following changes have been made to the code in order to get the expected plot.
lev = np.linspace(-0.5, 0.5, 10)CS = ax2.contourf(X, Y, Z, 10, cmap=plt.cm.rainbow, origin=origin, levels=lev)Additional information
No response
Operating system
Windows
Matplotlib Version
3.4.3
Matplotlib Backend
Qt5Agg
Python version
Python 3.8.12
Jupyter version
No response
Installation
pip