-
-
Notifications
You must be signed in to change notification settings - Fork 8.3k
ImageGrid in 3.0 #12505
Copy link
Copy link
Closed
Labels
Release criticalFor bugs that make the library unusable (segfaults, incorrect plots, etc) and major regressions.For bugs that make the library unusable (segfaults, incorrect plots, etc) and major regressions.status: duplicate
Milestone
Description
Metadata
Metadata
Assignees
Labels
Release criticalFor bugs that make the library unusable (segfaults, incorrect plots, etc) and major regressions.For bugs that make the library unusable (segfaults, incorrect plots, etc) and major regressions.status: duplicate
Type
Fields
Give feedbackNo fields configured for issues without a type.
Bug report
Bug summary
ImageGrid seems to be broken on 3.0.0?
Code for reproduction
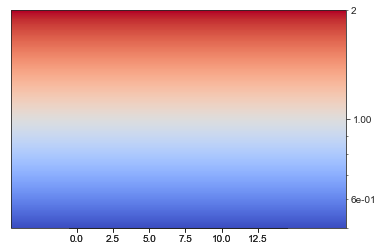
Actual outcome
Expected outcome
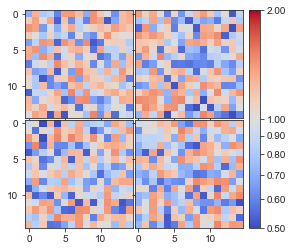
From 2.2.2
Note: if I remove all colorbar-related code, it again looks weird, but in a different way:
Seems like maybe all axes take up the whole figure, and so cover the rest?.. Just a guess.
Matplotlib version
print(matplotlib.get_backend())): inline